Recombination desert on HS rat Chromosome 13
- By: Faith Okamoto
- Analysis: June & July 2024
- Writeup: July 2024
This is long and loosely patterned off of "Y and Mitochondrial Chromosomes in the Heterogeneous Stock Rat Population" (Okamoto et al. 2023). Some phrasings, especially in Methods, were almost exactly copied. Some figures were made in Google Drawings.
Introduction
Palmer Lab is part of a collaboration which uses heterogenous stock (HS) rats for genetic mapping. Over generations, each HS offspring becomes a unique "genetic mosaic of the founders' haplotypes" (Solberg Woods and Mott 2017). Forming haplotype mosaics requires crossovers. These occur in HS rats at a rate of ~0.66 cM/Mbp (Littrell et al. 2018). Modern HS rats have diverse haplotype mosaics due to ~100 generations of breeding.
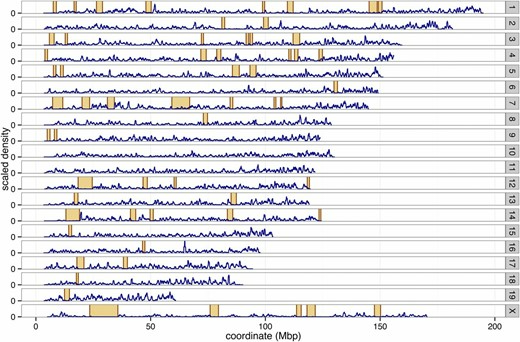
Figure 1. Recombination deserts in a mouse population. Crossover rate on Y-axis, variant position on X-axis. Orange boxed regions have a low rate of crossover events. Taken from Figure 6 in Liu et al. 2014.
However, ~0.66 cM/Mbp is averaged across the genome. Of particular concern are "recombination deserts", or regions with very low crossover frequencies. These are known to exist in, for example, mice (Liu et al. 2014). Without recombination, HS rats' fine haplotype mosaics cannot arise.
Suppressing recombination, therefore, is detrimental to genetic studies. High loadings in principal component analysis (PCA; also see the article "Should GWAS in HS rats use PCs as covariates?") and unusual patterns of long-range linkage disequilibrium (LD) suggest that Chromosome 13 (chr13) has a recombination desert, possibly due to an inversion on HS chr13 (Palmer Lab, personal communication). Large inversions prevent recombination between the inversion and non-inversion haplotypes (Li et al. 2023). We aim to find the location and cause of the recombination desert.
Materials & Methods
Genotype data
Modern HS rats were genotyped with ~0.25x coverage via double-digest genotyping by sequencing (Gileta et al. 2020) or low-coverage whole-genome sequencing (WGS). Biallelic single nucleotide polymorphisms (SNPs) on mRatBN7.2 chr13 were imputed by STITCH, as described in Chen et al. 2023. We filtered SNPs by standard thresholds:
- minor allele frequency (MAF) of ≥ 0.005
- missing rate of ≤ 0.1
- Hardy-Weinberg equilibrium (HWE) p-value of ≥ 10-10
Additionally, SNPs were filtered out as empirically unreliable if inbred founder genotypes had heterozygosity or missingness. The final dataset had 301,682 chr13 SNPs called in 18,608 rats.
Founders were genotyped with ~40x coverage via WGS of one male from each of the 8 founding strains (Hansen and Spuhler 1984). SNPs and indels on mRatBN7.2 were called by GATK, as described in Chen 2022. Variants were filtered to the SNPs in the modern low-coverage genotypes. The final dataset had 301,477 SNPs called in 8 rats.
A subset of 88 modern HS rats underwent high-coverage WGS. Using the standard filters, the final dataset had 475,038 chr13 SNPs and indels called in 88 rats.
We created genetic relationship matrices (GRMs) using PLINK on various genotype datasets. All input SNPs underwent the standard filters.
Calling haplotypes in modern HS rats
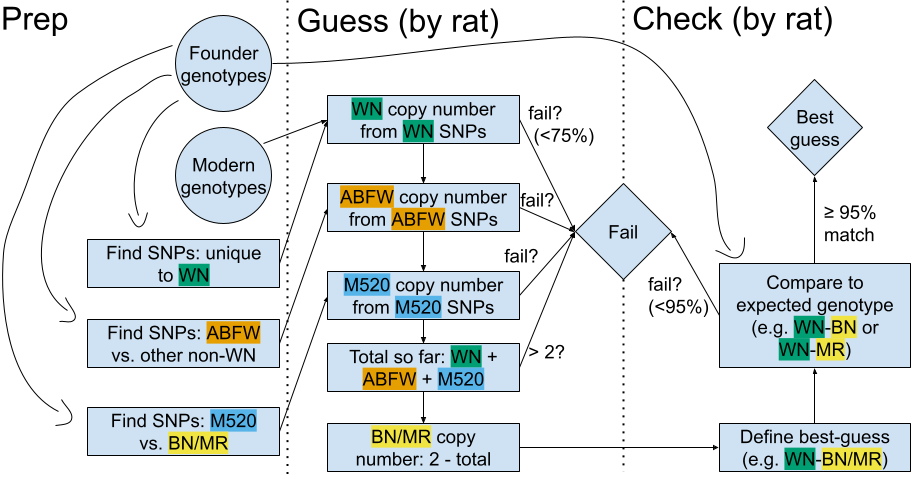
Figure 2. Flowchart of haplotyper. Circles indicate inputs. Rectangles indicate analyses. Diamonds indicate output/final haplotypes.
In a recombination desert, haplotypes present in the founder strains should theoretically be inherited fully intact; the exact sequence of SNP genotypes is passed on unbroken by recombination. To test this assumption, we called nonrecombinant chr13:0-12Mbp haplotypes (57,225 SNPs included):
- Estimate copy number of WN, ACI/BUF/F344/WKY (abbreviated ABFW), and M520 haplotypes. For each haplotype:
- Choose "haplotype" SNPs where the current haplotype has allele A2, and all later haplotypes (e.g. M520 and BN/MR for ABFW calculation) have A1
- Guess copy number (e.g. heterozygous haplotype SNPs support copy number 1)
- If haplotype SNP genotypes agree at least 75% (e.g. 75% heterozygous) with putative copy number, call that copy number. Otherwise the caller fails
- Sum all putative haplotype copy numbers.
- If more than 2, the caller fails
- If less than 2, then the remaining haplotypes are assumed to be BN/MR
- At all SNPs, compare actual genotype to expected genotype. (For ABFW or BN/MR haplotypes, use whichever founder is best.) If there is at least a 95% match, this pair founder haplotypes is called. Otherwise the caller fails.
We did not call individual founders for ABFW or BN/MR. A paucity of intragroup SNPs makes that too difficult and unreliable using low-coverage genotype data.
PheWAS
We performed a phenome-wide association study (PheWAS) using archived data (Okamoto et al. 2024), to see if chr13 haplotypes have a noticeable macro-scale effect. Phenotypes were pre-processed by linear regression to remove covariates, and then quantile normalized. We used a GRM of 4,900,347 SNPs (filtering out chr13 SNPs) to account for non-chr13 autosomal relatedness (Yang et al. 2010).
We encoded each haplotype as a SNP, designating the specific haplotype as A2 and all other haplotypes as A1, so that their genotypes reflected their copy number. We ran GCTA's mixed linear model-based association (MLMA; Yang et al. 2014) with these genotypes, phenotypes, and GRM. We applied Benjamini & Hochberg (BH) correction across all phenotypes, separately for each haplotype.
Gene expression
We used "log2" read count RNA-seq data on mRatBN7.2 for 10 tissues from RatGTEx, to see if chr13 haplotypes have a noticeable molecular effect. We expected to find effects on some Chromosome 13 genes due to causal cis regulatory elements, or at least LD with such variants. We prepared data separately for each tissue as follows:
- Remove samples without a a haplotype.
- Remove genes with detectable expression in less than 10% of samples.
- Apply Trimmed Mean of M values (Robinson and Oshlack 2010) normalization.
- Regress expression against haplotype copy number, separately for each gene and haplotype; a linear mixed model is unnecessary in HS rat expression quantitative trait loci (eQTLs) analysis (Munro et al. 2022).
- Apply BH across all genes and tissues, separately for each haplotype.
Software
- GCTA version 1.94.1 Linux, used for running MLMA
- PLINK version 1.90b6.21 64-bit (19 Oct 2020), used for making GRMs, running PCA, and general genotype filtration
- R version 4.3.3. Packages used:
cowplotversion 1.1.3, used for plot themes/arrangementdata.tableversion 1.15.4, used for general data managementedgeRversion 4.0.16, used for running TMM (not differential expression)genioversion 1.1.2, used for reading/writing PLINK-binary files in Rggplot2version 3.5.1, used for general plottingmagickversion 2.8.4, used to adding external images to figure panelsr.utilsversion 2.12.3, used to read gziped files
Code is in GitHub (currently requires access to Palmer Lab's GitHub account).
Results/Discussion
HS rat recombination desert at chr13:0-12Mbp
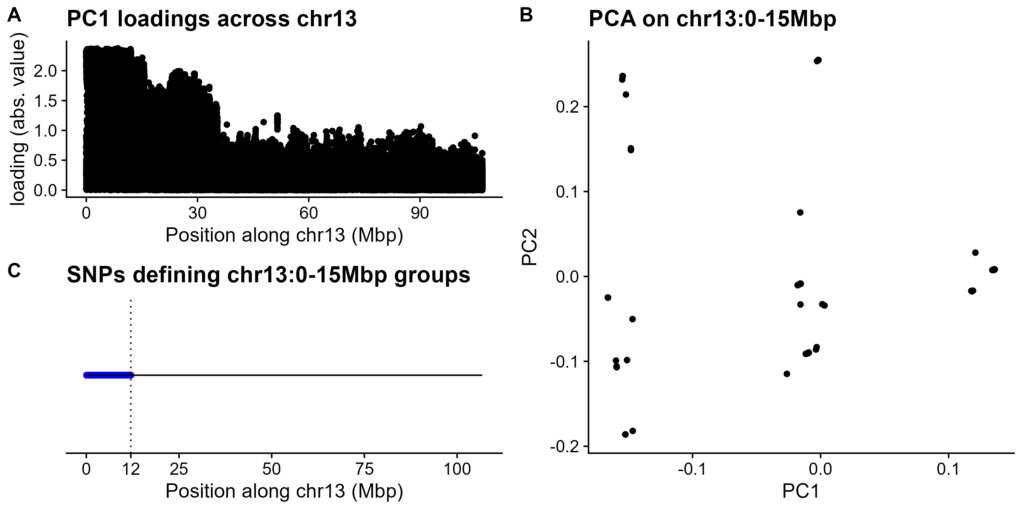
Figure 3. Location of chr13 recombination desert. A. PC1 loadings for chr13 SNPs and indels in high-coverage modern HS rat genotypes. Absolute value of loading on Y-axis, variant position on X-axis. B. PCA of variants within chr13:0-15Mbp. PC1 on X-axis, PC2 on Y-axis. C. SNPs distinguishing the groups from Panel B. Dotted line is approximate end of haplotype SNPs.
A large recombination desert would be picked up by PCA as simple way to separate samples. While PCA on high-coverage modern HS rat genotypes did not result in clear groupings of rats (Figure S1A), the loadings on PC1 had a clear pattern: high loadings at the start of chr13, with a steep drop-off at 15Mbp (Figure 3A).
PCA on this high-loading region revealed 3 groups (Figure 3B; Figure S1B). This is as expected if PC1 was picking up on a haplotype present on 0, 1, or 2 copies of chr13. We next established which SNPs defined this haplotype, i.e. are uniformly heterozygous for the middle group and oppositely homozygous for the other groups (Figure 3C). These putative recombination desert SNPs cluster within the gene-poor region of chr13:0-12Mbp.
Founder haplotypes in chr13 recombination desert persist largely unbroken
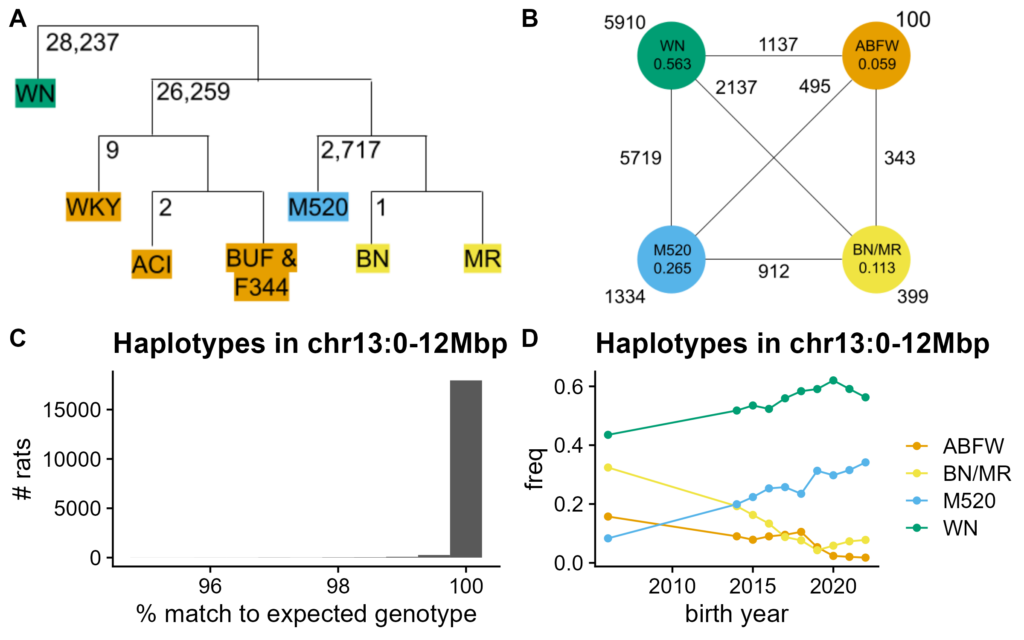
Figure 4. Haplotypes in chr13 recombination desert. A. Relationship between haplotypes of chr13:0-12Mbp SNPs in founders. Branches labeled by number of divergent SNPs, e.g. 26,259 SNPs diverge between ABFW and all other non-WN haplotypes. Branch lengths are meaningless. B. Distribution of haplotypes in modern HS rats. Haplotype frequencies in full dataset are included in labeled circles. Counts near haplotypes are for homozygotes. Counts between haplotypes are for heterozygotes. C. Match percent to founder haplotypes for modern HS rats. Calculated as percent of SNPs with expected genotype given haplotype assignment. Histograms by haplotype in Figure S2. D. Haplotype frequencies in modern HS rats over time. Frequency on Y-axis, birth year on X-axis.
We next examined haplotypes in the putative recombination desert (Figure 4A). There are four founder groups: WN, ABFW, M520, and BN/MR. We called haplotypes in modern HS rats assuming no recombination (Figure 4B). While this assumption works in practice, a few rare recombination events are visible (e.g. Figure S3). However, these recombinants are so rare that they are ignored in later sections.
Modern HS rats match their assigned nonrecombinant founder haplotypes well, for all four haplotypes, despite using low-coverage data (Figure 4C; Figure S2). The caller failed on 177 rats (< 1%), 46 of which have the recombinant haplotype from Figure S3. 16,777 of the other 18,431 rats match their assigned haplotypes perfectly. An inversion only prevents recombination between two groups of haplotypes. These data instead suggest low recombination in general, which can be causal for inversions, instead of an effect (Sun et al. 2017).
The groups in Figure 3B are due to WN's haplotype (Figure S1C). This is likely because WN is the most divergent of the haplotypes, as well as the most common (Figure 4C-D). When WN copy number is held constant, PCA separates by ABFW and then BN/MR copy numbers, in order of haplotype divergence (Figure S4).
These haplotypes significantly affect genome-wide summaries
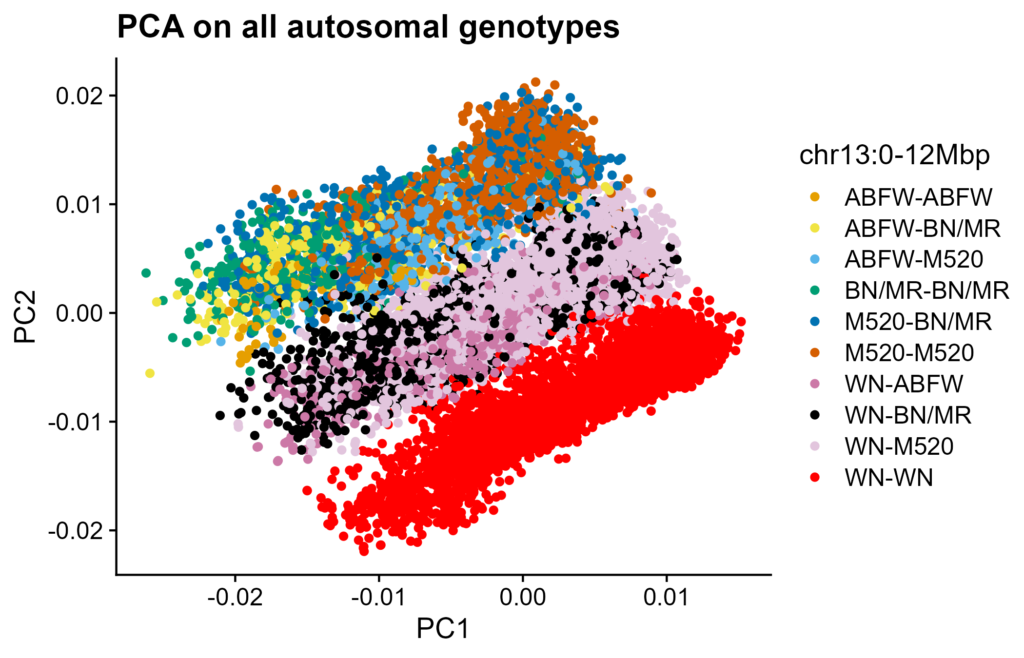
Figure 5. PCA of all autosomal SNPs. Low-coverage modern genotypes. PC1 on X-axis, PC2 on Y-axis. Rats colored by group from Figure 4B.
We investigated whether recombination desert haplotypes have significant effects genome-wide effect. PCA on HS rat genotypes is known to have a 3-bar pattern, uncorrelated to batch effects. These bars separate by WN copy number (Figure 5). Along/within each bar, rats separate by birth year (Figure S5).
We also checked if these haplotypes affected GRM values to an unusual degree. A recombination desert should have a large effect: many variants "agree" on whether a pair of rats is related. Therefore, removing those variants en masse should shift relatedness. Indeed, a GRM with the desert removed has a large shift in relatedness between homozygotes, compared to an all-autosomes GRM. Such an effect not seen when removing the opposite end of chr13 (Figure S6).
These haplotypes are not associated with phenotypes
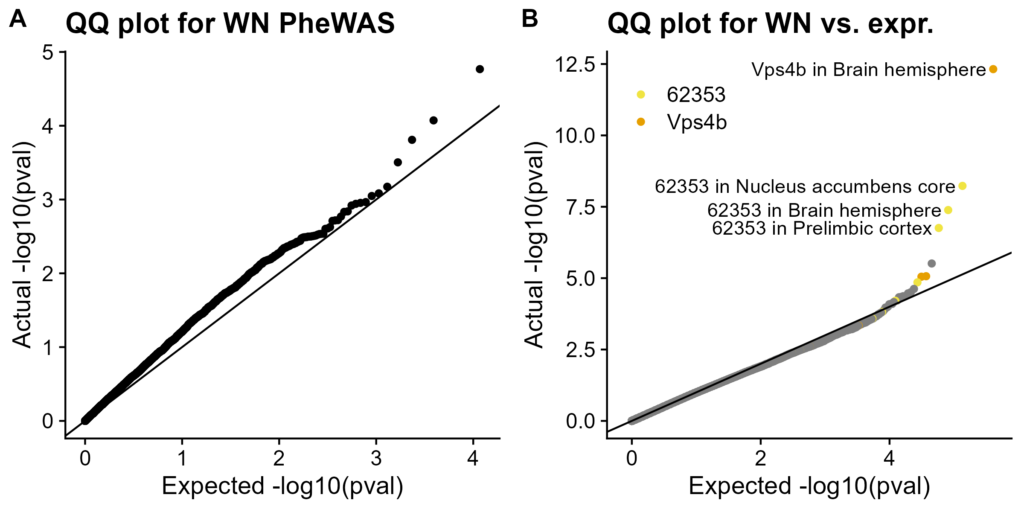
Figure 6. QQ plots of WN vs. other haplotypes. QQ plots for other haplotypes in Figure S7. Actual distribution of p-values on Y-axis, expected distribution (null hypothesis of no association) on X-axis. A. PheWAS using MLMA. Each dot represents one trait. B. eQTL analysis using linear regression. Each dot represents one gene in one tissue. Dots for two significantly associated genes, in both the tissue with an association and in other tissues, are specially colored. Significant associations are labeled
We ran PheWAS on these haplotypes. There are no significant associations with multiple-test corrected p-value (FDR) < 0.05 (Figure 6A, Figure S7A-D). This matches our experience: HS rat associations do not localize to this region (Oksana Polesskaya, personal communication).
We also tested association with gene expression (Figure 6B, Figure S7E-H). Two genes, Vps4b and ENSRNOG00000062353, have FDR < 0.05 correlations with WN copy number. (One more, Cntnap5c, is associated with ABFW copy number.) Two of these genes have cis-eQTLs elsewhere on chr13 (Vps4b, Cntnap5c); our signal is due to LD with those stronger cis-eQTLs. The other gene is on chrX. We found no useful information besides its Ensembl ID, thus, it is difficult to interpret. Also, it has quite low expression is most groups (Figure S8).
Conclusion
There is a 12Mbp recombination desert at the start of HS Chromosome 13. It can be haplotyped by matching modern genotypes to unrecombined founder genotypes, and shows up in genome-wide summaries such as PCA and GRMs. Groupings due to this region (e.g. the PCA bands in Figure 5) are not due to batch effects. They are correctly genotyped and are as expected.
While this region is large and obvious, it does not have significant effects on the phenotypes Palmer Lab and collaborators study. This may be due to having little functional consequence and being generally gene-poor. Thus, it is of little concern for standard genetic studies.
Our data are ambivalent about the presence of inversion(s) on chr13. However, any single such inversion would not be causal for the recombination desert.
References
Chen D. 2022. Palmer Lab High Coverage WGS Genotyping Pipeline. doi:10.5281/zenodo.6584834.
Chen D, Chitre A, Cheng R, Peng B, Polesskaya O, Palmer A. 2023. Palmer Lab Heterogeneous Stock Rats Genotyping Pipeline. doi:10.5281/zenodo.10002191.
Gileta AF, Gao J, Chitre AS, Bimschleger HV, St. Pierre CL, Gopalakrishnan S, Palmer AA. 2020. Adapting Genotyping-by-Sequencing and Variant Calling for Heterogeneous Stock Rats. G3 Genes|Genomes|Genetics. 10(7):2195–2205. doi:10.1534/g3.120.401325.
Hansen C, Spuhler K. 1984. Development of the National Institutes of Health Genetically Heterogeneous Rat Stock. Alcohol: Clinical and Experimental Research. 8(5):477–479. doi:10.1111/j.1530-0277.1984.tb05706.x.
Li H, Berent E, Hadjipanteli S, Galey M, Muhammad-Lahbabi N, Miller DE, Crown KN. 2023. Heterozygous inversion breakpoints suppress meiotic crossovers by altering recombination repair outcomes. PLOS Genetics. 19(4):e1010702. doi:10.1371/journal.pgen.1010702.
Littrell J, Tsaih S-W, Baud A, Rastas P, Solberg-Woods L, Flister MJ. 2018. A High-Resolution Genetic Map for the Laboratory Rat. G3 Genes|Genomes|Genetics. 8(7):2241–2248. doi:10.1534/g3.118.20018.
Liu EY, Morgan AP, Chesler EJ, Wang W, Churchill GA, Pardo-Manuel de Villena F. 2014. High-Resolution Sex-Specific Linkage Maps of the Mouse Reveal Polarized Distribution of Crossovers in Male Germline. Genetics. 197(1):91–106. doi:10.1534/genetics.114.161653.
Munro D, Wang T, Chitre AS, Polesskaya O, Ehsan N, Gao J, Gusev A, Solberg Woods LC, Saba LM, Chen H, et al. 2022. The regulatory landscape of multiple brain regions in outbred heterogeneous stock rats. Nucleic Acids Research. 50(19):10882–10895. doi:10.1093/nar/gkac912.
Okamoto F, Chitre AS, Sanches TM, Chen D, Munro D, NIDA Center for GWAS in Outbred Rats, Polesskaya O, Palmer AA. 2023. Y and Mitochondrial Chromosomes in the Heterogeneous Stock Rat Population. :2023.11.29.566473. doi:10.1101/2023.11.29.566473. [accessed 2024 Jul 8].
Okamoto, F; Chitre, AS; NIDA Center for GWAS in Outbred Rats; Palmer, AA. (2024). Data from: Y and MT Chromosomes in the Heterogeneous Stock Rat Population. In The Center for GWAS in Outbred Rats Database (C-GORD). UC San Diego Library Digital Collections. doi:10.6075/J0VX0GQQ
Robinson MD, Oshlack A. 2010. A scaling normalization method for differential expression analysis of RNA-seq data. Genome Biology. 11(3):R25. doi:10.1186/gb-2010-11-3-r25.
Solberg Woods LC, Mott R. 2017. Heterogeneous Stock Populations for Analysis of Complex Traits. Methods Mol Biol. 1488:31–44. doi:10.1007/978-1-4939-6427-7_2.
Sun Y, Svedberg J, Hiltunen M, Corcoran P, Johannesson H. 2017. Large-scale suppression of recombination predates genomic rearrangements in Neurospora tetrasperma. Nat Commun. 8(1):1140. doi:10.1038/s41467-017-01317-6.
Yang J, Benyamin B, McEvoy BP, Gordon S, Henders AK, Nyholt DR, Madden PA, Heath AC, Martin NG, Montgomery GW, et al. 2010. Common SNPs explain a large proportion of the heritability for human height. Nat Genet. 42(7):565–569. doi:10.1038/ng.608.
Yang J, Zaitlen NA, Goddard ME, Visscher PM, Price AL. 2014. Advantages and pitfalls in the application of mixed-model association methods. Nat Genet. 46(2):100–106. doi:10.1038/ng.2876.
Supplementary Figures
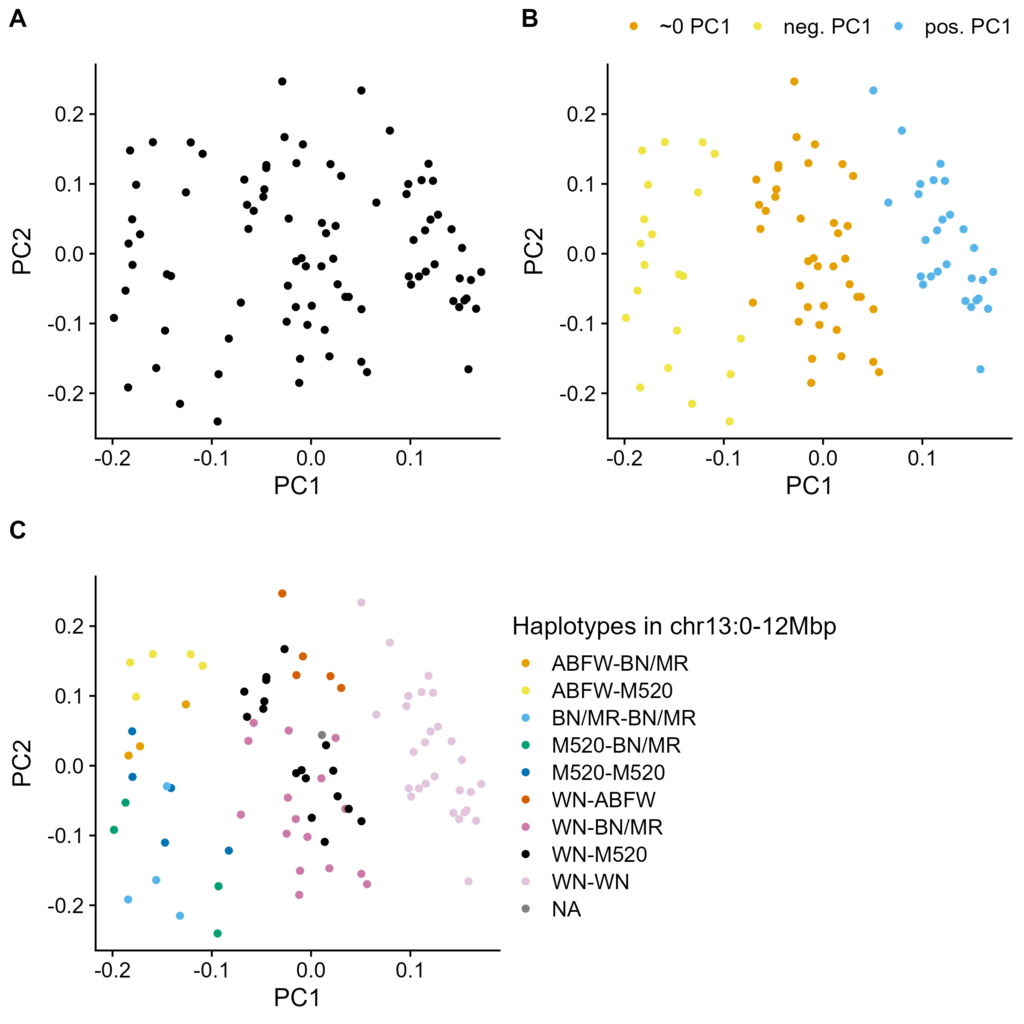
Figure S1. PCA of chr13. High-coverage modern genotypes. PC1 on X-axis, PC2 on Y-axis. A. Original biplot. B. Biplot colored by groups from Figure 3B, i.e. groups separated by PCA on chr13:0-15Mbp. C. Biplot colored by group from Figure 4B, i.e. from Figure 2 haplotyper.
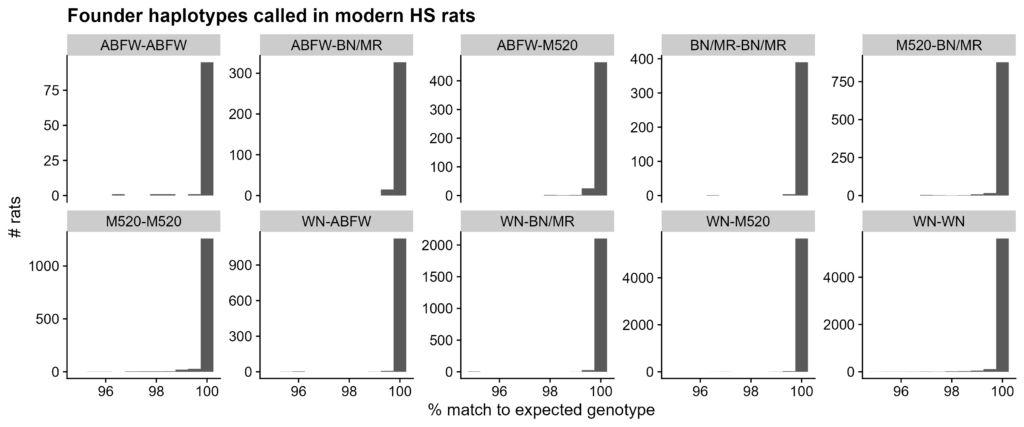
Figure S2. Match percent to founder haplotypes among modern HS rats. Calculated as percent of SNPs with expected expected given haplotype assignment. Boxplots separated by founder haplotype assignment. Note from Figure 2 that a minimum match of 95% was required by the haplotype caller.
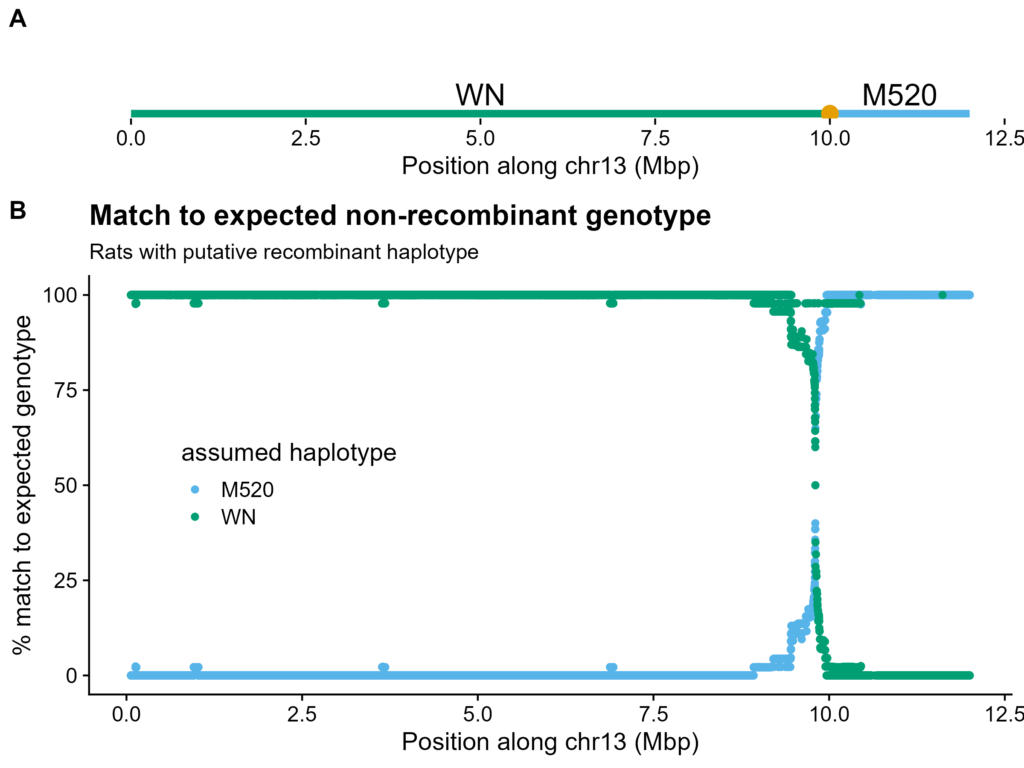
Figure S3. Example of a recombinant haplotype. A. Components of recombinant haplotype, with putative breakpoint as large circle. B. Match to expected non-recombinant genotype, i.e. for BN-(WN-M520 recombinant), as if it were only BN-WN, or BN-M520. Each rat was matched to its most likely other, non-recombinant chromosome haplotype. Percent of rats matching on Y-axis, position along chr13 on X-axis.
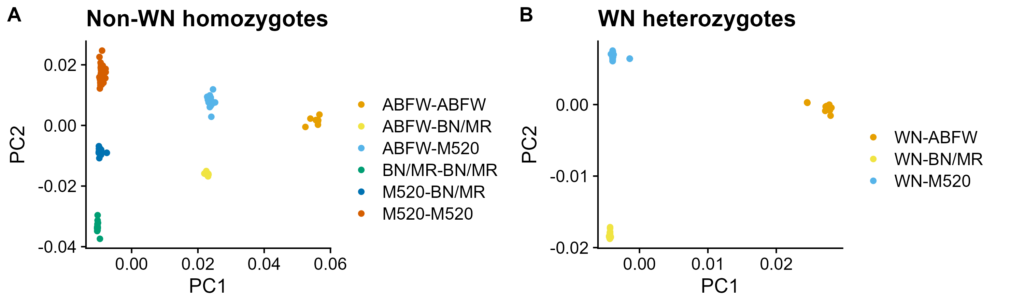
Figure S4. PCA of chr13:0-12Mbp with WN copy number held constant. Low-coverage modern genotypes. PC1 on X-axis, PC2 on Y-axis. Colored by group from Figure 4B. A. Non-WN homozygotes. B. WN heterozygotes.
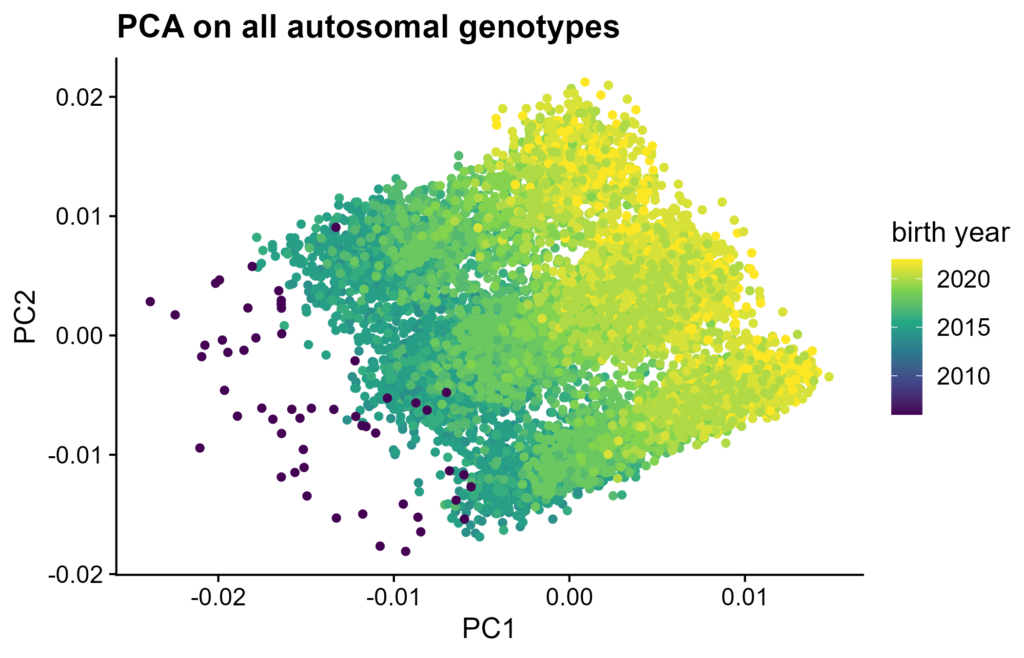
Figure S5. PCA of all autosomal SNPs colored by birth year. Low-coverage modern genotypes. PC1 on X-axis, PC2 on Y-axis. Rats only included if their birth year was known
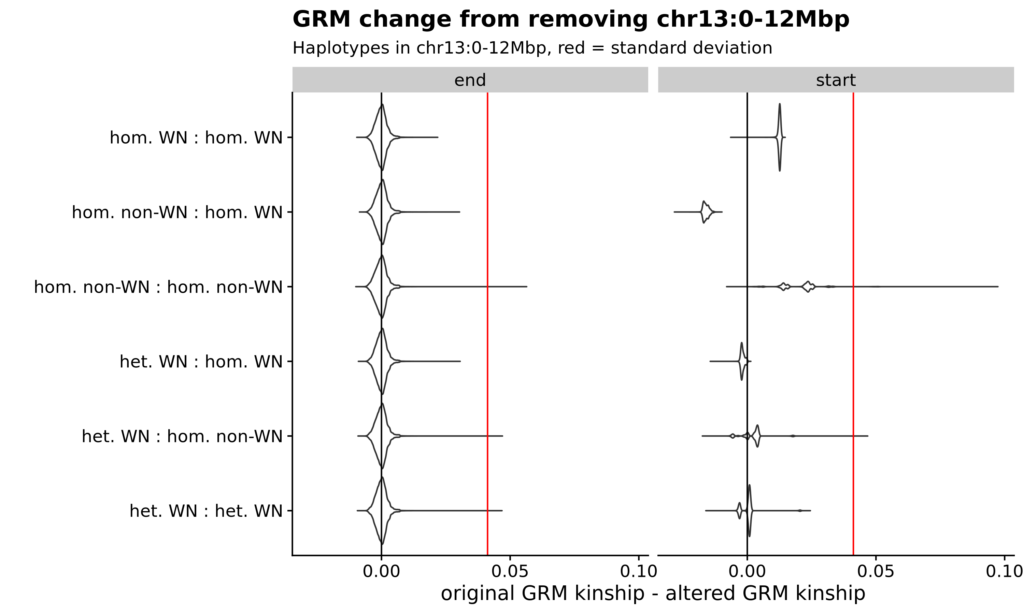
Figure S6. GRM changes due to chr13 recombination desert. Violin plots of GRM value changes when removing SNPs from either end of chr13. Difference between original and adjusted GRM on X-axis, haplotype group on Y-axis. Black line is no change. Red line is the standard deviation of original GRM. On left, when removing the non-desert end, changes are random and normally distributed as expected for normally variable regions. On right, when removing the desert end, there are pronounced changes between homozygotes.
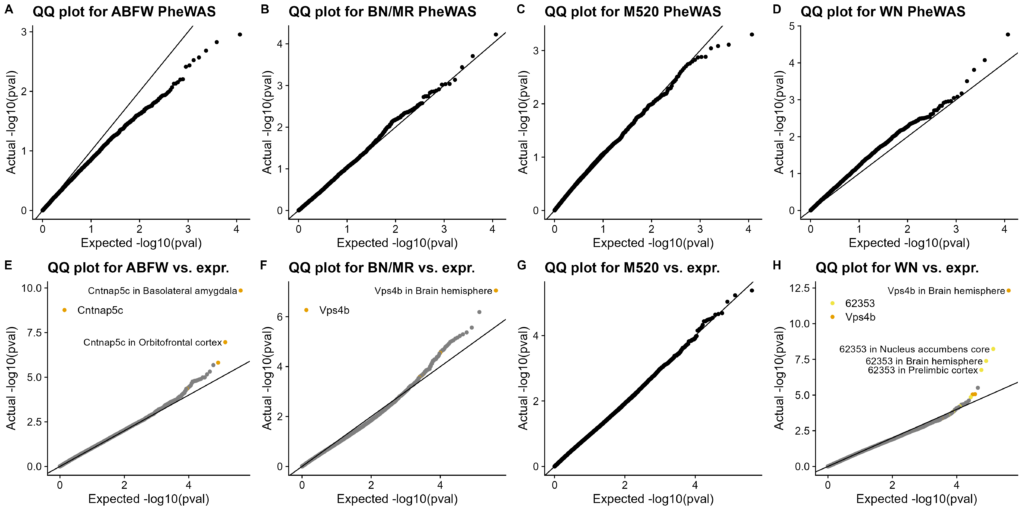
Figure S7. QQ plots of association tests. Actual distribution of p-values on Y-axis, expected distribution (null hypothesis of no association) on X-axis. A-D. PheWAS using MLMA. Each dot represents one trait. A. WN vs. other haplotypes, B. ABFW vs. others, C. M520 vs. others, D. BN/MR vs. others. E-H. eQTLs using linear regression. Each dot represents one gene in one tissue. Genes with significant associations are specially colored. All significant associations are labeled. E. WN vs. other haplotypes, F. ABFW vs. others, G. M520 vs. others, H. BN/MR vs. others.
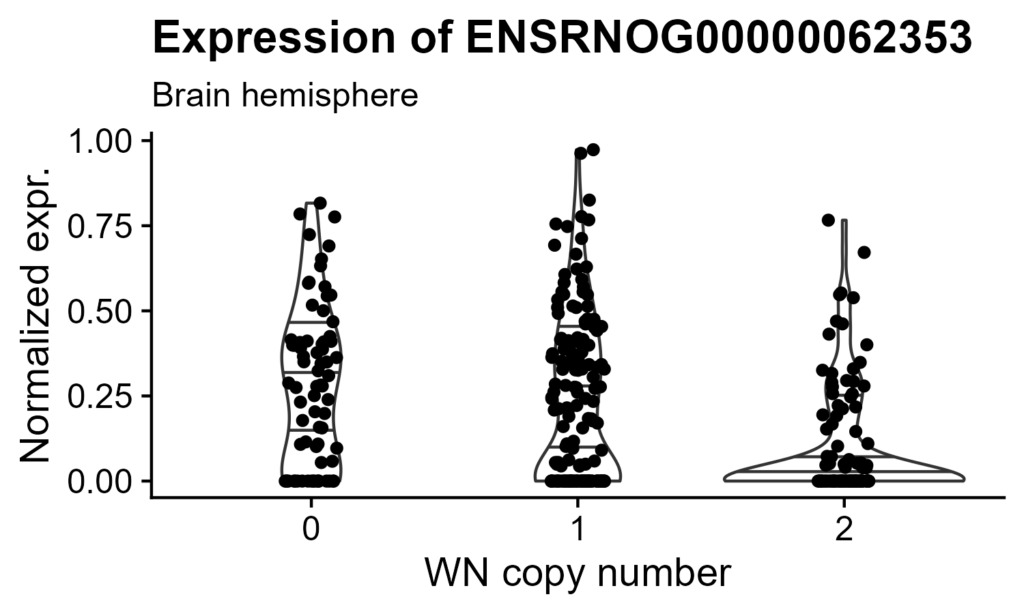
Figure S8. WN trans-eQTL. WN copy number on X-axis, TMM-normalized expression of chrX ENSRNOG00000062353 on Y-axis. Quantile lines included.

Comments are closed.